
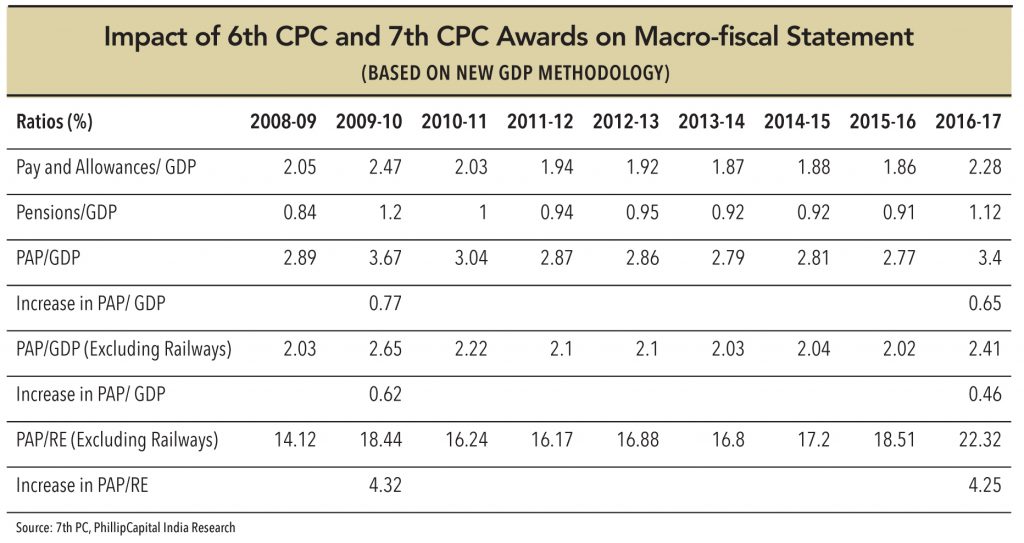
Along with the pressures of pay commission and finance commission (lower share of the centre in the tax pool), the government also has FRBM targets to achieve. Since the 7th PC report has been submitted on time, it will warrant lesser arrears (unlike the 5th and 6th). Hence, it should have a limited impact on government finances vis-a-vis the previous commissions. However, the PAP-GDP (pay-allowance-pension) ratio is bound to rise. The objective was to keep the PAP-GDP ratio lower than that of 6th PC, which was at 0.77% excluding arrears (in 2009-10). The 7th PC recommendations will result in an extra spending of Rs 1tn (0.65% of GDP, 0.46% excluding railways). Due to the increase in salaries because of the 7th PC, proportion of salaries as a percentage of revenue expenditure will rise by 4.25% vs. a 4.32% rise in the 6th PC.
Assumptions:
• For FY17, real GDP growth of 7.5% and inflation at 4%
“There is no fiscal space available to increase the share of the total spending on PAP (pay, allowances, and pension) other than that afforded by GDP growth. The share of PAP in total revenue expenditure will, at best, stay constant over the medium term.”
– 7th PC
Is there evidence of a rise in income tax revenues as government salaries increased under pay commissions? Based on the analysis of the last two pay commissions (5th and 6th), tax revenue increase was negligible when the commissions were implemented, but there was improvement after a lag of one year. Some other noteworthy points:
• Coincidentally, the last two commissions have been implemented during times of recession (1997-98 – East Asian crisis and 2008-10 – financial crisis). Therefore, it is difficult to confidently conclude the exact impact – income tax collection would have increased for the government employees, but fallen for the rest due to the impact of the crisis.
• Total government employees strength is 4mn (only 11% of the 35mn total taxpayers in India). Thus, an increase in the tax payment by these employees will not stand out much.
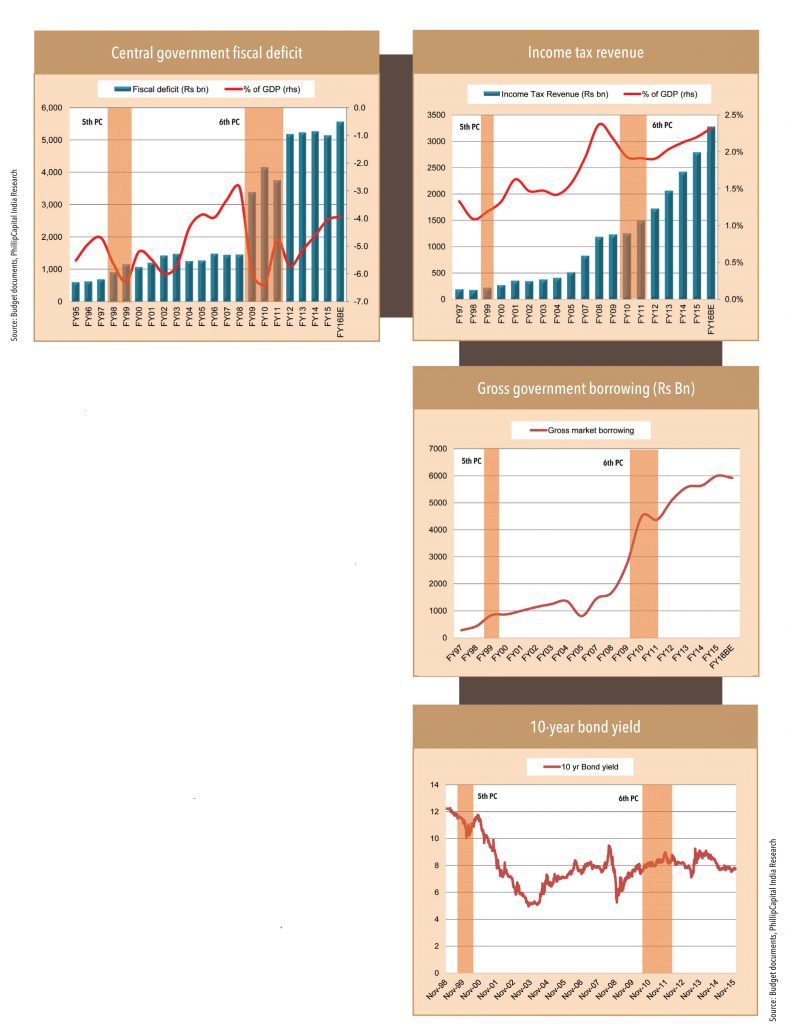
The positive impact on income tax due to pay commissions is insignificant (limited strength of central government employees within total tax payers in India), which results in higher fiscal deficit. Higher fiscal deficit is funded by higher internal borrowing – therefore, gross market borrowings by the government rise. These borrowings increased to Rs 838bn in FY99 from Rs 279bn in FY97 (fifth pay commission) and to Rs 4.5tn in FY10 from Rs 1.7tn in FY08 (impact of sixth pay commission). Some of this increase can be attributed to the fiscal stimulus that the government had to dole out because of the financial crisis. Average 10-year bond yield was at 7.91% in FY08 – it fell to 7.6% in FY09 and 7.2% in FY10. The fall was muted despite a 225bps cut in repo rate and 200bps cut in CRR – reflecting the impact of higher borrowing.
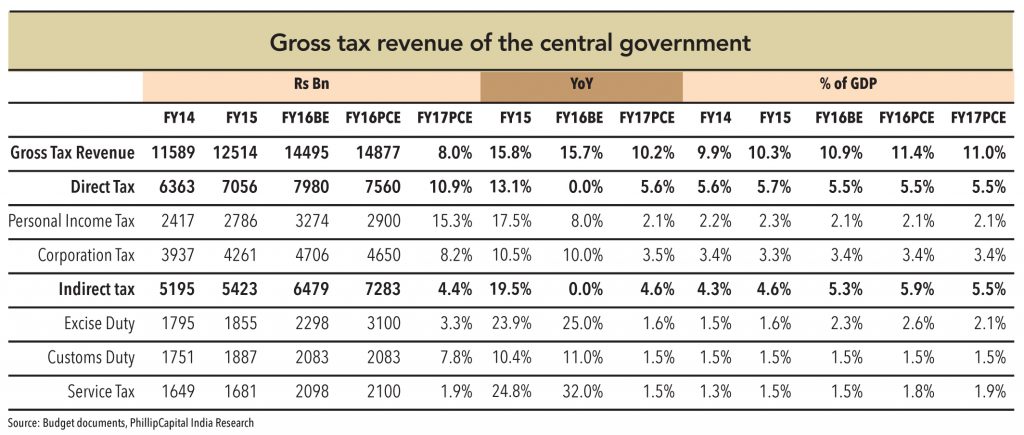
Fiscal deficit for FY16 is likely to hover around the budgeted target of 3.9% of GDP. Direct taxes have been lower than budgeted by the government due to poor employment generation, salary hikes, and corporate profitability. Within indirect taxes, customs and service tax collections should be in line with the budgeted estimates while excise duty collection is likely to significantly surpass targets (higher excise duty on petroleum products – in FY16 the government increased excise duty on petrol/diesel by Rs 4.1/6.6; in FY15 by Rs 8/6.7; total excise duty currently is Rs 20.5/15.8). In fact, lower crude oil prices have made it possible for the government to achieve its FY16 fiscal target. Without this, due to slippage in other taxes and disinvestment, the government would have found it difficult to achieve its fiscal deficit target or to stay on course in terms of capital spending. The latter is believed to be the only positive contributor to capex in India now, as the private sector grapples with poor demand and excess capacity.
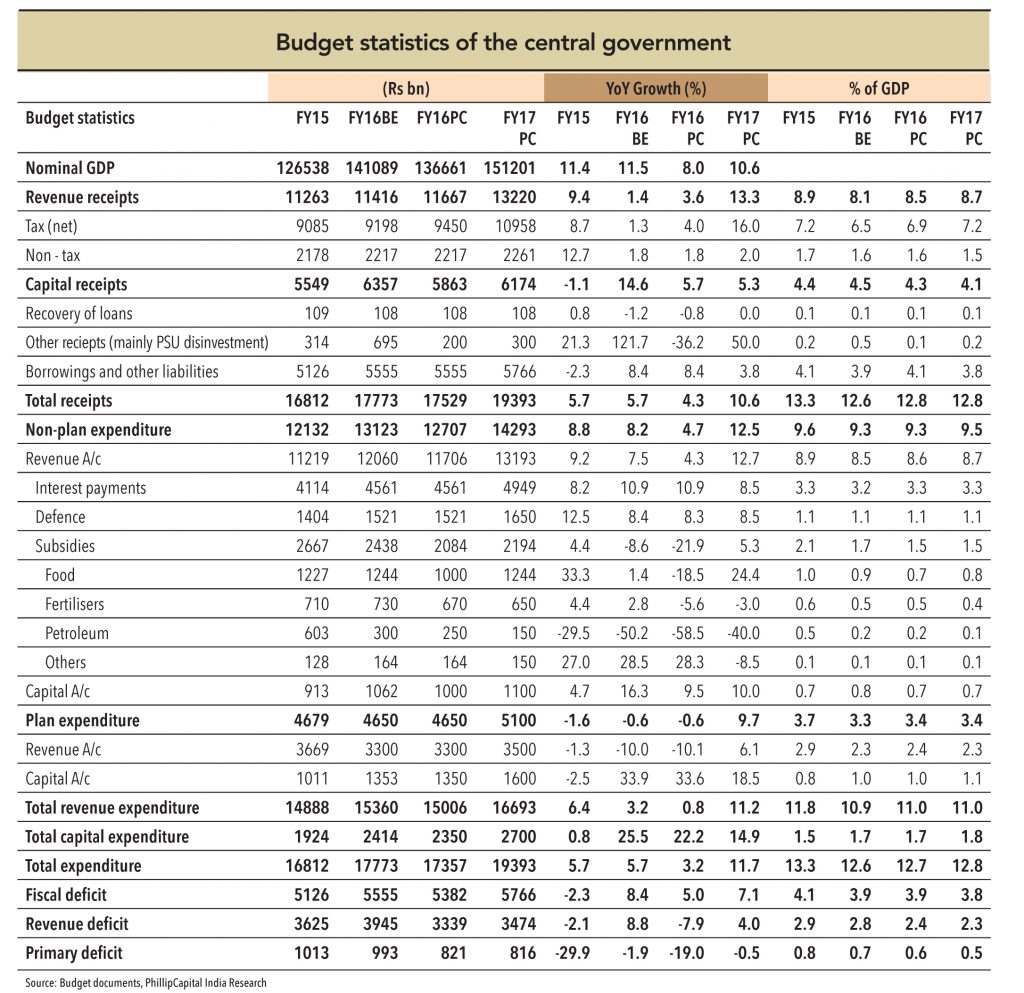
The FY16 fiscal deficit target will be met with a small reduction in capital spending, subsidies (food and fertiliser), and higher excise duty on petroleum products. If excise duty on oil products cannot be raised further, other expenditure will have to be shelved in order to achieve the target. There is additional pressure on fiscal deficit (impact of -10bps) because nominal GDP growth has been lower than what was assumed during the budget (at 8% vs. budgeted 11.5%). This implies that in order to achieve the fiscal deficit target as percentage of GDP, absolute value of the fiscal deficit will have to be lower to the same extent. Additionally, there is a shortfall from disinvestment. We expect the government to stay focused on FY16 fiscal deficit as a percentage of GDP – absolute value at Rs 5.38tn vs. budgeted Rs 5.55tn – while allowing FY17 fiscal deficit estimate (3.5%, set earlier under FRBM) to slip.]
When the NDA government came into power in May 2014 and presented its first budget in July 2014 (for FY15), it retained focus on fiscal consolidation (in line with the UPA government). The government could have chosen to revive growth by giving fiscal stimulus as growth was dwindling, but it didn’t do so. Prior to the budget announcement, fiscal deficit for FY15 was expected to be 4.5% of GDP (Click here)(vs. 4.6% in FY14) – however, the government chose to follow the path of fiscal consolidation by budgeting a fiscal deficit at 4.1% – at the cost of economic growth. It would have been possible to alter the prior government’s strategy of fiscal consolidation for at least a few years – the rating agencies would have been forgiving (considering the magnitude of positive expectations from India led by PM Modi). Alas – this did not come to pass.
A year later, when the government announced its FY16 budget, it revealed some delays in the path of fiscal consolidation (a year’s delay in achieving 3% deficit – target shifted to FY18 from FY17). FY16 target was set at 3.9%, FY17 at 3.5%, and FY18 at 3%. to support economic growth along with implementation of the 14th finance commission, which would provide more funds to states.
The finance minister, Mr Arun Jaitley, will present the Union budget for FY17 on 29th February 2016. The background to the budget is weakening domestic growth (not stabilising), worsening global growth (along with partial stimulus reversal), low commodity prices, negative investor sentiments, and the seventh pay commission. This warrants more focus on spending even as tax revenue growth moderates – implying higher fiscal deficit.
Three scenarios can play out. The government could:
1.Retain focus on fiscal consolidation and lower developmental spend – implying fiscal deficit target of 3.5-3.6%.
2.Take a balancing approach towards fiscal constraints and developmental spend – implying fiscal deficit target of 3.8-3.9%.
3.Focus on developmental spend and economic growth revival – implying fiscal deficit target of 4.1-4.2%.
Scenario 2 is the most likely, as scenario #1 will be detrimental to growth and scenario 3 will attract negative attention from rating agencies, as they will perceive sharp slippage in fiscal deficit along with slowing economic growth as risky. We believe that India is in a comfortable position considering that Indian GDP growth at 7% is still amongst the best across the globe.
For FY17, fiscal deficit is likely to slip to 3.8% of GDP based on the following assumptions:
• Nominal GDP growth at 10.6%, real GDP growth at 7.5%.
• In order to align with the future GST rates, service tax rate will be raised – this will support tax revenue along with higher excise duty on petrol and diesel.
• Disinvestment of Rs 300bn
• Additional payout of Rs 700bn under the ‘salaries’ head – impact of seventh pay commission. Here, the assumption is that the balance amount of Rs 300bn will be postponed to next year or some reduction in payout will happen due to partial acceptance of the pay commission recommendations (which is the buzz).
• Subsidy outgo at 1.5% of GDP, similar to FY16. Average crude oil price assumed at US$ 40 per barrel.
• Capital spending orientation to persist – capital expenditure growth assumed at 15% vs. 22% in FY16.
• Focus on defence sector also expected to persist in FY17.
Higher fiscal deficit will lead to higher government borrowing and put pressure on bond yields as well as dissuade RBI from monetary policy easing. In the absence of further rate reductions, higher borrowing yields will be a deterrent for growth revival.
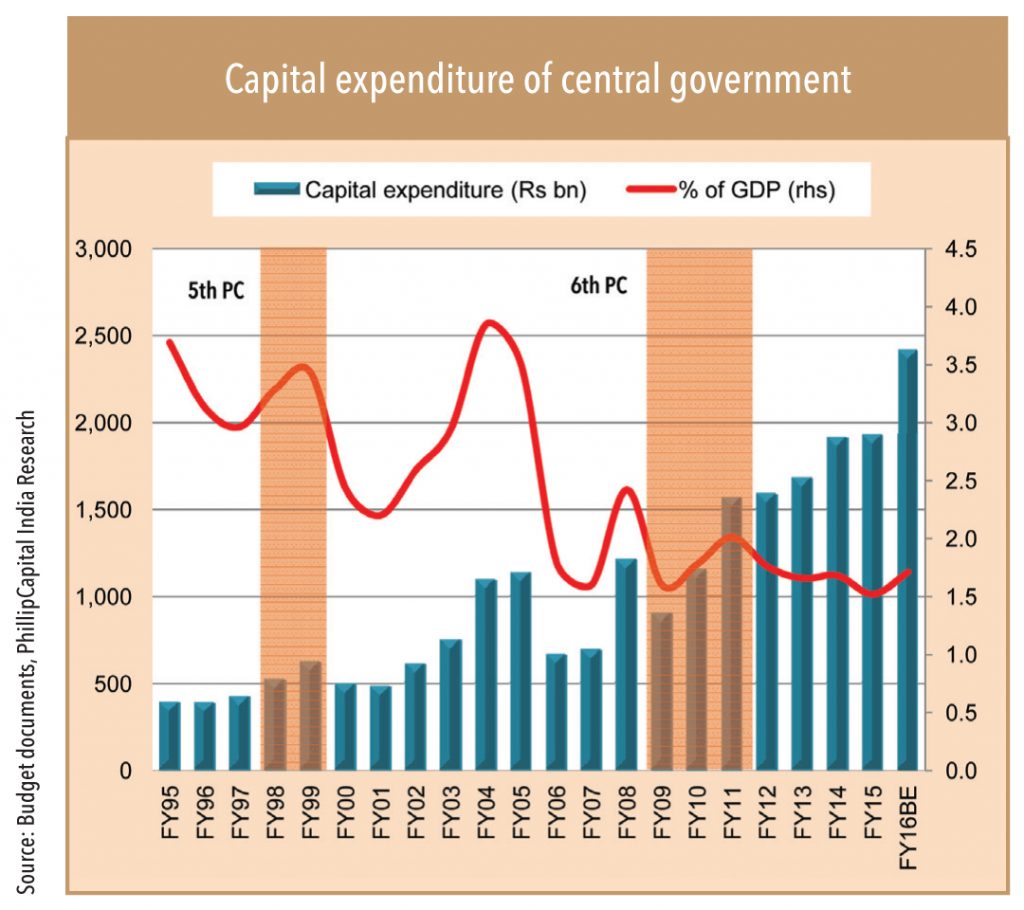
Centre’s capital expenditure
Based on 5th and 6th PC analysis, capital expenditure stayed on course during the years of reward. Currently, continuation in capital spending boost is much needed for the economy, thus it is likely that the government will increase capex budget by 10-12% (if not more, vs. 34% in FY16) along with meeting the pay commission obligation.
• 5th PC – Plan capital expenditure of the centre rose by 9% in FY98 and 10% in FY99 from 26% in FY97 (stayed at 1.5% of GDP).
• 6th PC – Plan capital expenditure stayed strong in FY09-12 – (+27% In FY09, +26% in FY10, +28% in FY11) – (0.7%/0.8%/0.8% of GDP).
“Government service is not a contract. It is a status. The employees expect fair treatment from the government. The states should play role models for services.”
– 7th PC
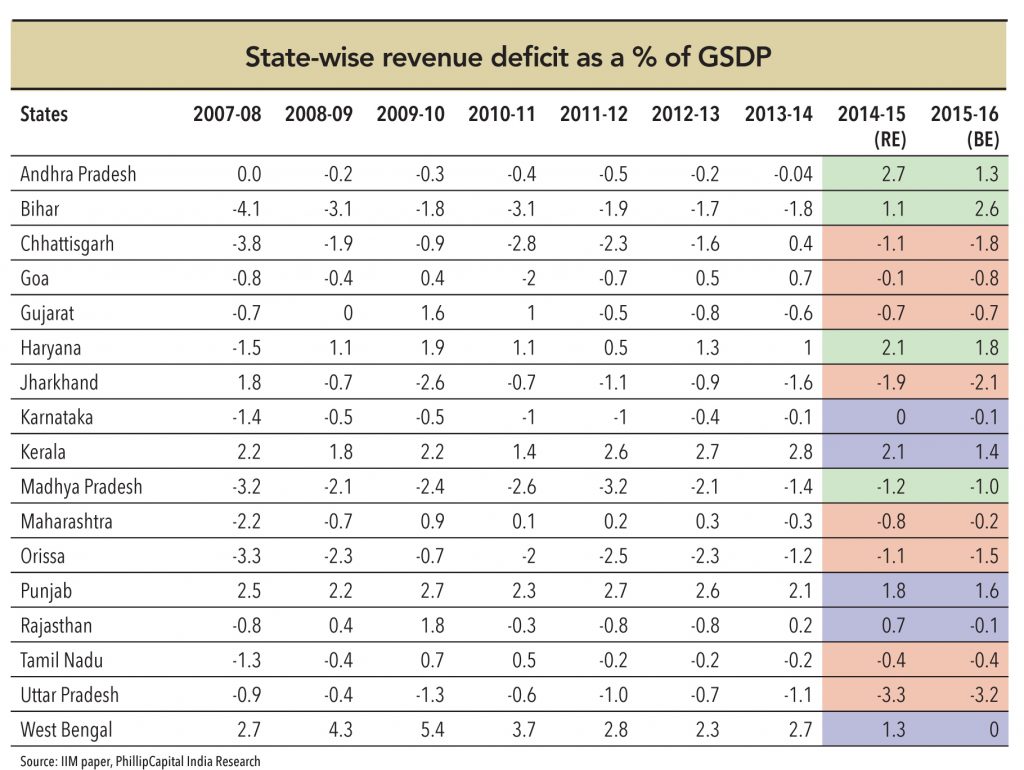
Impact of pay commission on state finances generally lasts at least for two-years and typically for much longer (4-5 years). FRBM targets have enabled a contained fiscal deficit for states. Most states follow recommendations of central pay commissions (thus, average salary hike should be in the range of 10-14%; PAP hike at 18-24%). Consolidated revenue deficit of all the states is at 0.4% in FY15. Similar trends are expected in FY16 as well due to higher allocation of taxes to states. Combined state revenues as a percentage of gross state domestic product (GSDP), have been stable at 7.7% for last three years. Financially-weak states have already been given higher funds (recommended by 14th finance commission), which should help them in balancing fiscal deficit along with sensibly distributing/allocating salary hike based on individual state’s capacity and not necessarily following the centre’s pay commission recommendations.
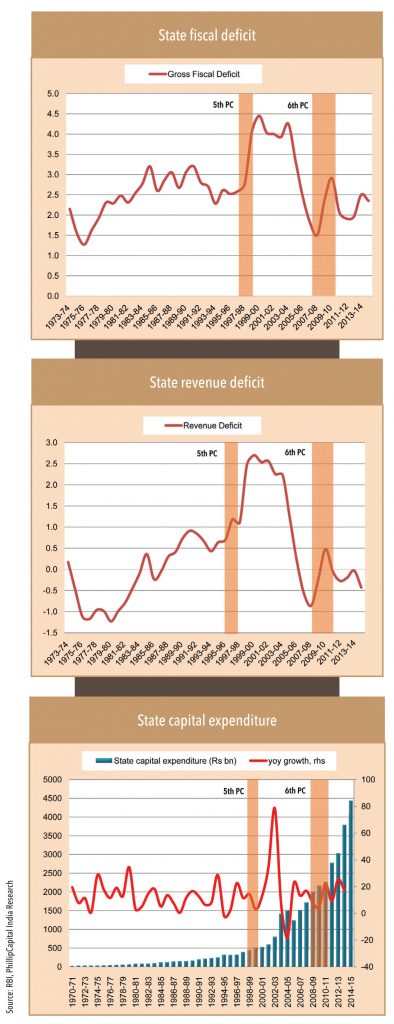
The combined state fiscal deficit shot up substantially during the fifth pay commission and lasted for a few years. The impact was felt in FY99, when fiscal deficit (as % of GDP) rose to 4.1% from 2.8% in FY98. This continued until FY04-05, when fiscal deficit ranged at 4.3% of GDP. Revenue deficit for states also shot up substantially for the same reason – it rose to as high as 2.6% in FY02 (from 1.1% in FY98) and stayed high at 2.2% until FY04. Therefore, in case of states, the impact lasts longer.
During the sixth pay commission, fiscal deficit rose to 2.4% in FY09 from 1.5% in FY08 and has stayed high since then. A part of the reason why fiscal deficit is high in the last few years is the general economic slowdown. Revenue deficit was in surplus (+0.23%) in FY09 and fell to deficit (-0.5%), but has turned into surplus since then – this means that the impact of sixth pay commission on revenue deficit was not very substantial. Similarly, we do not expect the impact of seventh pay commission to last for long.
States’ capital expenditure – This remained strong during the fifth pay commission but dwindled when the sixth pay commission was implemented, partially due to the economic slowdown.


Subscribe to enjoy uninterrupted access


