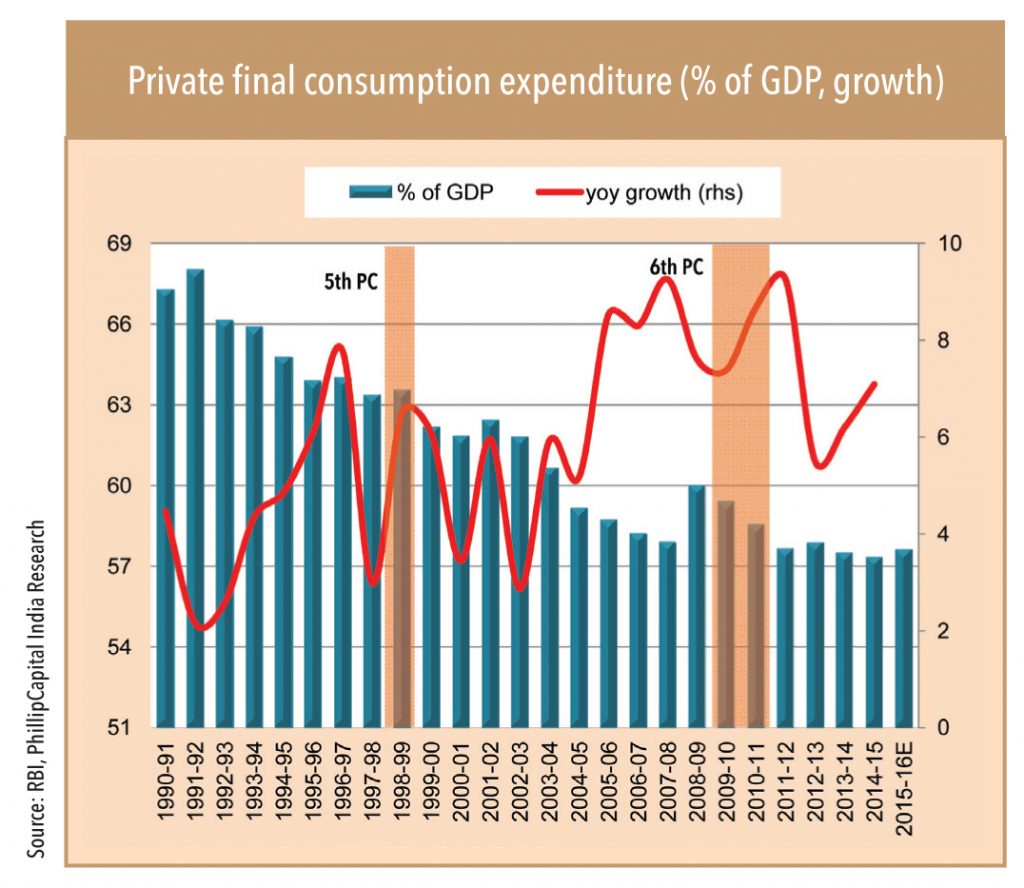
In the past commissions, private final consumption expenditure (PFCE) responded positively to higher government salaries – sometimes with a lag, sometimes immediately. In the 6th, it picked up after a lag of two years (to 9.3% in FY12 from 7.4% in FY10). During the 5th, the impact was immediate – felt in FY97 when PFCE growth picked up to 7.8% from 6% in FY96. However,after rising, PFCE almost always took a dip in a few years – indicating a similar pattern could play out after FY18.
Here is a look at how various sectors were affected (within PFCE) during the past two pay commissions:
Food
In general, this segment’s share in the total consumption basket is coming off. It currently stands at 30.5% from 35% five years ago and 40% ten years ago. There is not much consistency in the impact of pay commissions on food consumption, in general there was a positive influence – during the 5th it rose, fell, and rose again (before which its share was consistently falling). During the 6th, it increased in FY08, but its overall share in consumption continued to fall.
Clothing
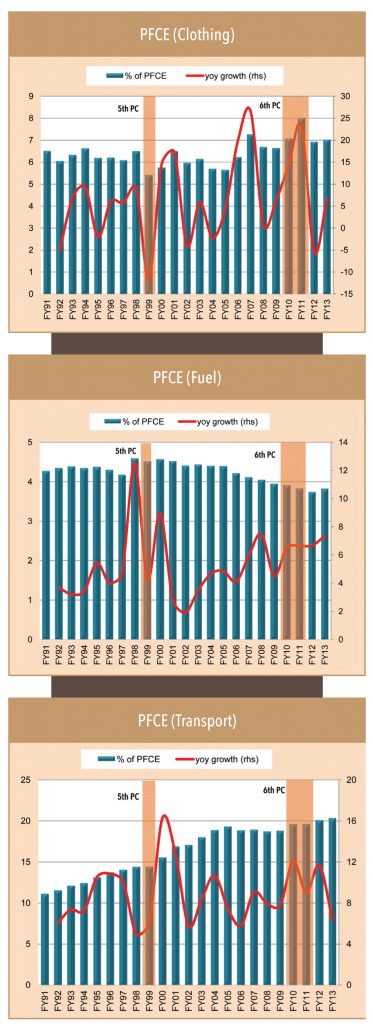
Spending on clothes and footwear moved up with a lag of one year during the 5th, while it registered usual growth in the sixth. Overall share of clothing in PFCE is trending higher (8.4% currently).
Fuel and power
Fuel consumption increased substantially during the 5th (with a lag of one year) while the impact was positive but not all that sharp during the 6th. This is consistent with the rise in automobile sales after a pay commission reward, along with higher usage of the existing ones.
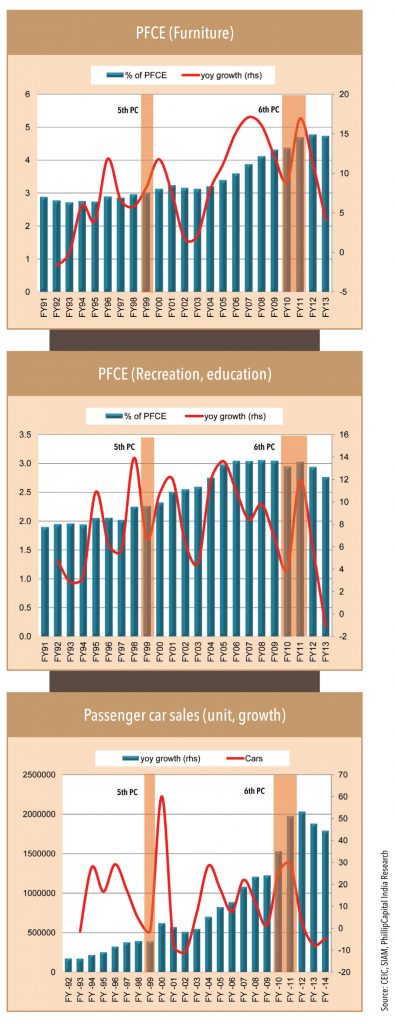
Furniture, furnishings, and household appliances
Spending on this segment has been rising in general and received a boost during both commissions, especially during the 6th.
Personal care and personal goods
Increased during both 5th and 6th.
Transport and communication
This saw a sharp increase in its role in the total consumption basket during the 5th – rose to 14.4% of PFCE in FY98-99 from 13.7% in FY96. It remained stable during the 6th.
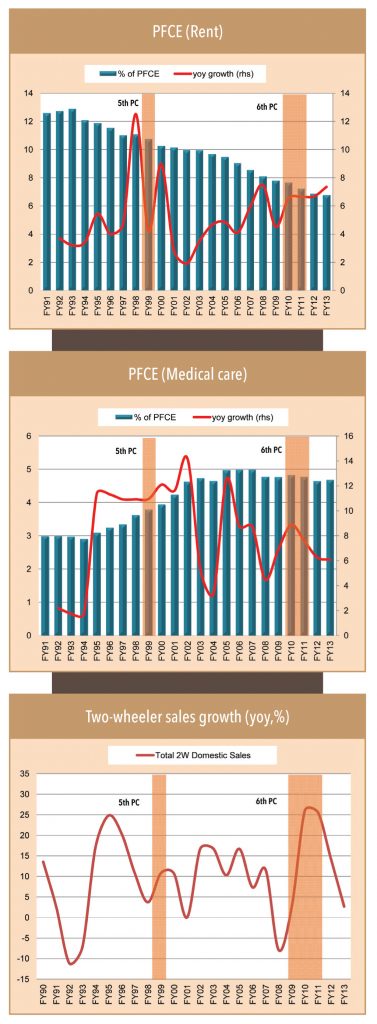
Rent
No change during the 5th, marginally better during the 6th. Share of rent in total consumption is declining – currently at 6.7%.
Health services
Spending on health increased during the 5th; no significant response in the sixth.
Education
Share (in consumption basket) as well as pace of growth picked up during the 5th. The 6th PC did not have any positive impact.
Two-wheelers
Growth picked up with a lag of one year during the 5th (11% yoy growth in FY99-00) and with a two-year lag after the 6th (+26% in FY10, +26% in FY11, and +14% in FY12). Sales growth in motorcycles was sharper (+27% in the 5th, +24% in the 6th). While scooter sales growth was insignificant during the 4th, it shot up during the 6th.
Passenger cars: Car sales picked up with a lag of two years in FY00, but by a whopping 60%. Impact was more substantial during the 6th PC, although with a lag of two years. Growth picked up to 25%/29% in FY10/FY11.
“Gaadi tho hai, ab property lena hai (Have a car, want to now buy property)”
– GV survey respondent survey


Subscribe to enjoy uninterrupted access


